 The S&P 500 ($SPX) just logged its second consecutive 1% gain on Tuesday. That’s three solid 1% advances so far in June. And with a few trading days remaining in the month, the index has recorded only one 1% decline so far.
A lot can still happen before the month ends, but, as it stands, June is looking a lot like May, which also saw three 1% gains and one 1% loss. Taken together, these months resemble May and June of last year, although back then the S&P 500 advanced 52 consecutive sessions without a single 1% decline.
What this means for you: After the volatility of March and April—and the sharp rebound in mid-April—there has been a notable shift toward a more consistent uptrend. We talk about this frequently, and it bears repeating: the characteristics of a steady uptrend are unmistakable. It’s the foundation of our analysis that shapes our market outlook.
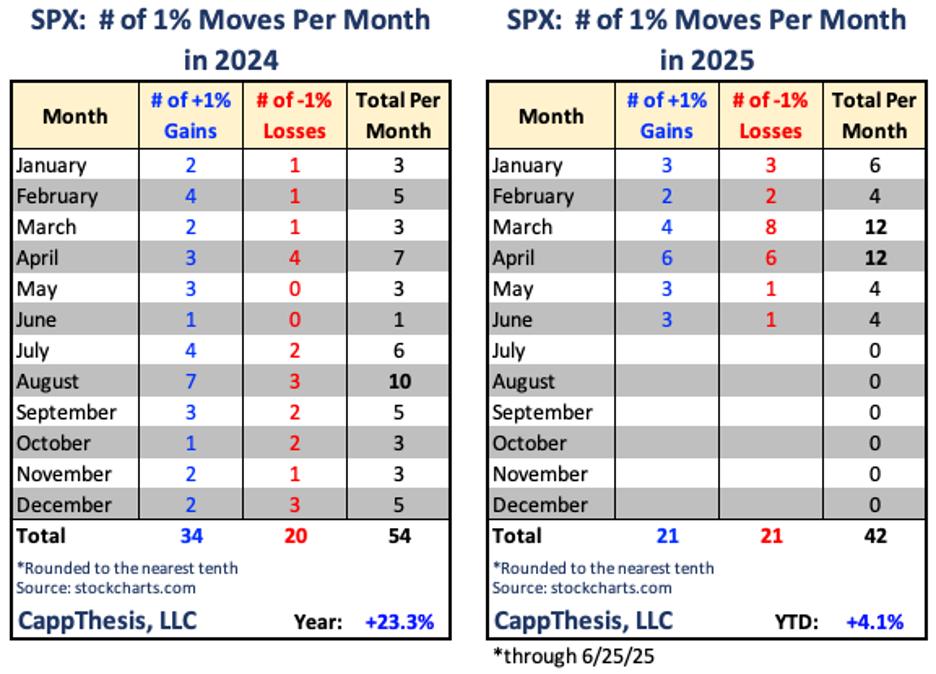
FIGURE 1. THE NUMBER OF 1% MOVES IN THE S&P 500 IN 2024 AND 2025. June is looking similar to May, which also saw three 1% gains and one 1% loss. It’s echoing the behavior we saw in May and June of 2024.
It all starts with daily price action. Low two-way volatility has set the tone in recent weeks. If this type of month-to-month tempo in daily moves continues, the uptrend can persist. The opposite, of course, is also true.
Zooming In On the Short-Term Moves
Looking at the S&P 500’s recent price action on the short-term chart, the index is now approximately +3% from its recent low last Friday. If this multi-day bounce were to stop now, it would be among the smallest over the last nine months. Indeed, most didn’t get much further before the next bout of profit taking, but this shows how the staircase-like advance could continue.
In other words, if this cadence persists, the S&P 500 could meander through its former highs, i.e., we may not see a resounding breakout. The more boring a move through 6,147, the better.
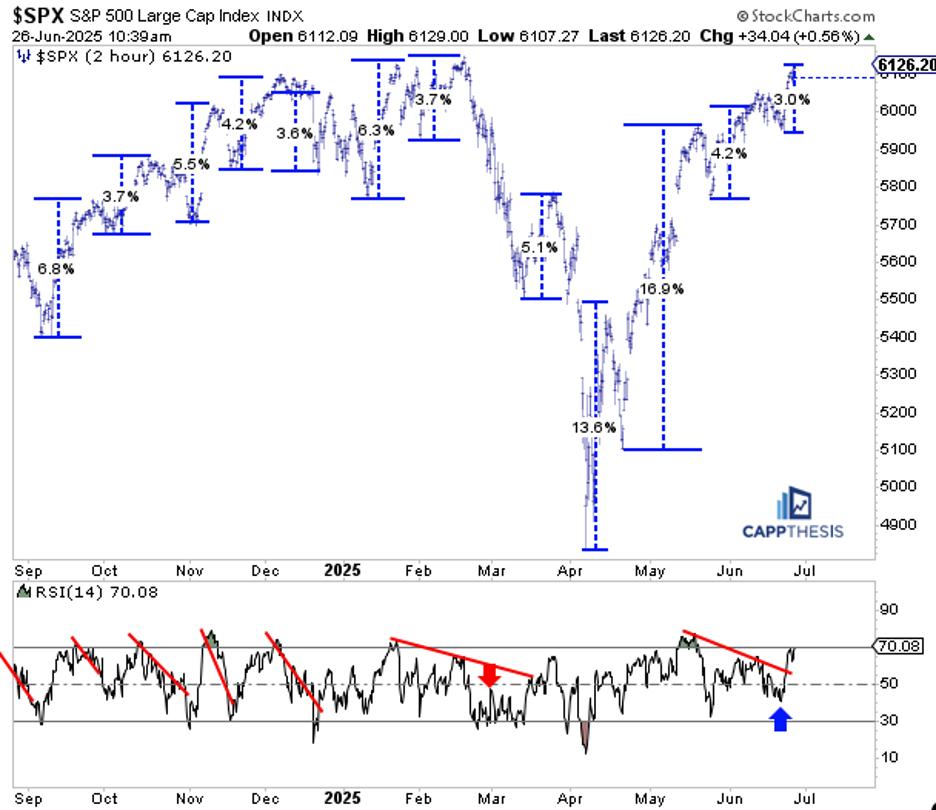
FIGURE 2. TWO-HOUR CHART OF THE S&P 500. The staircase-like advance in $SPX could continue, and the index could tiptoe through previous highs.
Also, notice how the recent drawdown only pulled the 14-period relative strength index (RSI) on this two-hour chart marginally below the 50 level, which shows that the momentum shift was limited last week. It’s a reminder of how weak the bounce attempt was in March, which set the stage for the second down leg of that move. If the reverse is now true, then another up leg could be afoot soon.
NVDA Stock: A Daily Perspective
NVDA made a new all-time high on Wednesday, the first since January 7. Its participation since the April 7 low has been a major and necessary piece to the SMH, XLK, NDX, and SPX’s rallies, and the global equity market’s overall comeback.
We last cited the stock on May 27 and May 29 (before and right after it reported earnings), noting the bull flag pattern. The flag has held throughout, and NVDA is now close to achieving that price target. So, what’s next?
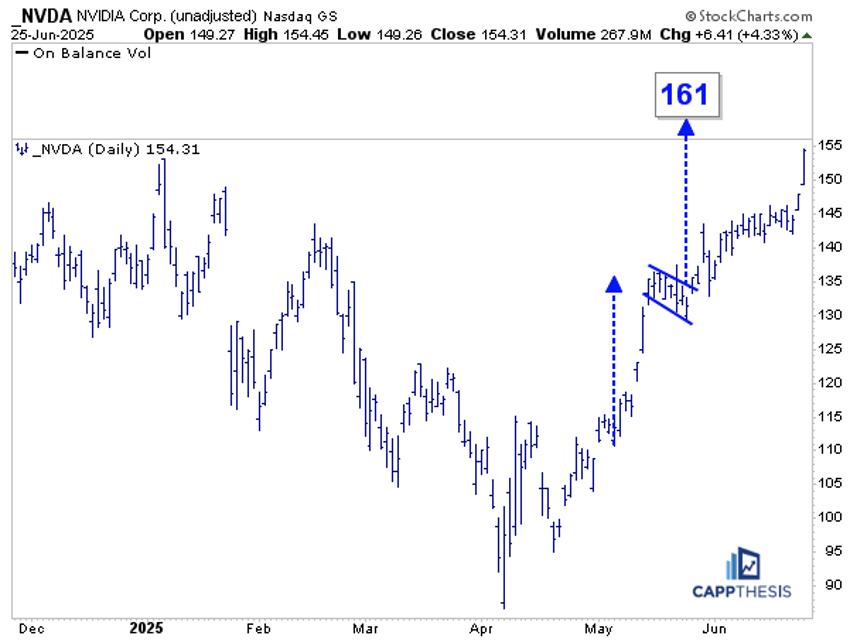
FIGURE 3: DAILY CHART OF NVDA’S STOCK PRICE. After the bull flag pattern, NVDA is close to achieving its price target.
NVDA vs. 200-Day Moving Average
NVDA’s comeback has pulled the stock back above its 200-day moving average. We’ve shown this before as the stock was coming back. The last few times NVDA reclaimed the long-term line after spending a long time below it, the stock advanced higher for years.
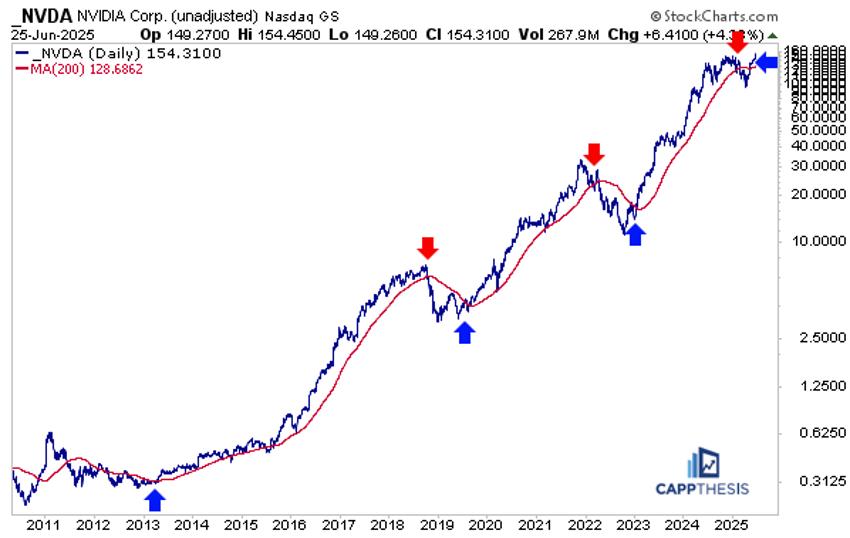
FIGURE 4. DAILY CHART OF NVDA WITH 200-DAY MOVING AVERAGE. The last few times NVDA broke above its 200-day moving average after spending a long time below it, the stock advanced higher for years.
NVDA Stock: A Weekly Perspective
Even though NVDA made a marginal new high in early January, there was no follow-through. Thus, NVDA remains net flat since November 2024 and isn’t too far above its spike highs from last June either.
Altogether, the round trip can now be viewed as one big bullish pattern. We’ve seen similar formations play out three times since the October low. Once NVDA finally got through those volatile periods and broke out, those strong extensions that we all remember well ensued. Past performance is no guarantee of future returns, but patterns tend to repeat no matter the timeframe. So, we need to respect that the same kind of breakout could happen again with the stock is sitting at the same levels as it was eight months ago, but with strong market-wide demand at its back.

FIGURE 5. WEEKLY CHART OF NVDA. Could a breakout with strong market-wide demand occur?
NVDA – GoNoGo
NVDA’s weekly trend just flipped to positive on the GoNoGo chart, as well. As is clear, the last time this happened was in early 2023, the same time that the first bullish pattern on the preceding chart happened.
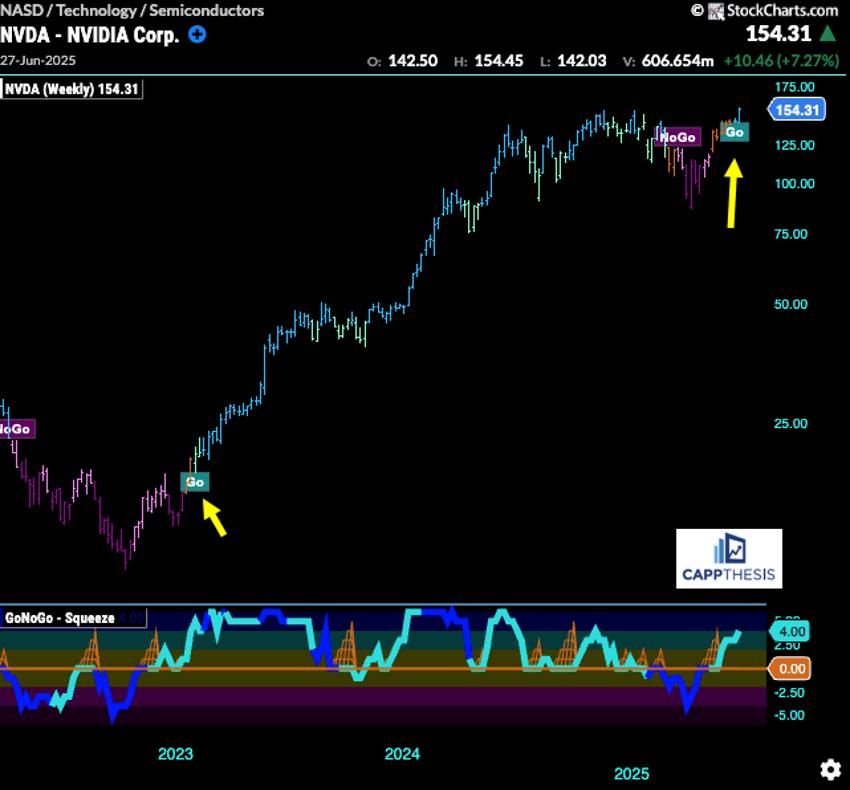
FIGURE 6. NVDA’S PRICE ACTION USING GONOGO CHART. The weekly trend just switched to positive. This happened in 2023, which is around the time the first bullish pattern occurred in the weekly chart in Figure 5.
NVDA Stock: A Monthly Perspective
Zooming way out, this also could be the fourth major breakout from a monthly perspective. The prior ones happened in 2015, 2020, and 2023.
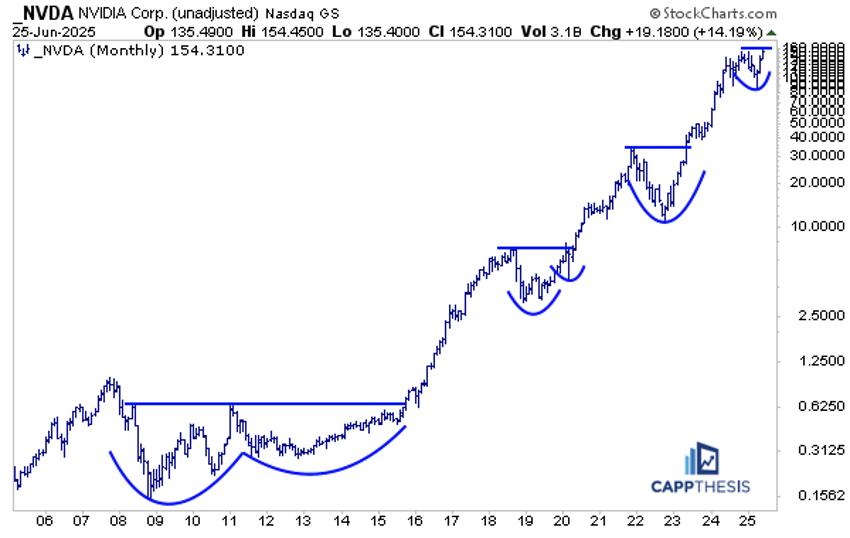
FIGURE 7. MONTHLY CHART OF NVDA. There could be a fourth major breakout in NVDA’s stock price.
The Bottom Line
If you’re someone who likes to stay invested with an eye on the long-term, this is the kind of environment where patience pays off. The S&P 500 appears to be building strength, and NVDA is helping lead the charge.